
Unmanned Aerial Vehicles (UAVs) are gaining increased popularity in a wide range of domains and applications. As a result, they are also becoming a target of malicious attacks. For example, drone impersonation of military or civilian drones can cause serious security and privacy breaches. There have been some recent contributions that aim to integrate digital certificates as an authentication tool for drones, but such software techniques are often defenseless against physical compromise. In this article, to the best of our knowledge, we are the first to propose a physical layer drone authentication framework to augment existing multifactor authentication schemes leveraging the unintentional Electromagnetic (EM) emissions of the drone’s electronic components. Our solution, Drone-Mag, exploits the inherent non-idealities and imperfections present in drones’ electronic integrated circuits that are introduced during their manufacturing process. Those emissions are hard to mimic or replicate, providing a robust basis for drone authentication. Drone-Mag is a passive, non-interactive, and privacy-preserving authentication solution and does not require software or hardware modifications to available drones. We test the performance of Drone-Mag focusing on the unintentional EM emissions of 23 drones. In particular, we addressed three main tasks: (i) identification of 14 different drones and flight controllers; (ii) authentication of 10 identical (same brand and model) drones; and (iii) rogue drone detection using autoencoders. All the listed tasks achieve a minimum average of 0.97 F1-score, showing the viability and efficiency of the proposed authentication method.
1 Introduction
Unmanned Aerial Vehicles (UAVs), often referred to as drones, are becoming increasingly popular due to their inexpensive cost and enticing features. Nowadays, drones are used for various functions, including inspections, perimeter management, remote monitoring, and emergency response [4]. With their rapid adoption in different domains, they have become an attractive attack target. For example, drone impersonation attacks can cause grave security and privacy violations in different scenarios. One possible scenario is the impersonation of a drone in the military field; if the impersonation is successful, the drone could be used for a number of rogue activities, such as attacking the opponent’s military infrastructure. As such, authenticating drones is of paramount importance. Furthermore, since UAVs can be integrated into many critical infrastructures, such as transportation systems and merchandise delivery, the potential threat of impersonation attacks extends beyond military scenarios to include both civilian and economic activities.
Unlike drone detection techniques that are well-developed [5, 24, 45], there are just a few existing drone authentication techniques such as broadcasting unencrypted identity information [13]. As this technique is not privacy-preserving and is susceptible to impersonation attacks, the use of Public Key Infrastructure and digital certificates is proposed to authenticate drones [3, 55]. Unfortunately, there are many attacks targeting such software-based solutions and allowing malicious impersonation by compromising certificate authorities or faking certificates [46].
Physical-Layer Security is gaining increased traction in recent years as it overcomes many of the limitations of standard cryptography-based authentication techniques [20, 61]. In particular, Physical-Layer Authentication (PLA) provides great compatibility and security with little complexity since it leverages the devices’ inherent physical layer characteristics rather than a secret key. As threats evolve and become more sophisticated, PLA can be integrated into existing multi-layered authentication frameworks to enhance the security of drone systems. PLA techniques are based on the fact that despite ICs are precisely built (with a tolerance in the order of – or -meter and using standardized materials), occasional structural deviations exist on a deep sub-micrometer level. As a result of such variances, there are no two ICs that are structurally 100% identical. The electrical components will function properly as long as those deviations remain within an acceptable limit. However, when an electric current runs through such ICs, an unintentional Electromagnetic (EM) field is generated, and the EM emissions released are unique to each individual IC. A dedicated EM probe can be used to detect such EM field emissions. The Maxwell’s equations [2] describe the complex creation process of such EM emissions.
Contribution. In this article, to the best of our knowledge, we are the first to explore fingerprinting drones by leveraging their unintentional EM emissions. We present Drone-Mag, an efficient, non-interactive, and privacy-preserving solution designed to verify the authenticity of drones and augment existing multi-factor authentication frameworks. Implementing an EM fingerprinting solution for drone authentication poses several technical challenges. First, the stability of EM emissions can be affected by environmental noise and external interference, necessitating precise data collection methods to ensure reliable fingerprinting. Second, distinguishing between different drone brands and models, as well as identical drones of the same make and model, requires a robust and scalable classification approach that balances accuracy and computational efficiency. Third, detecting rogue or imposter drones poses an additional challenge, as adversaries may attempt to mimic legitimate drones to gain unauthorized access. An effective solution must be capable of identifying such imposters even in high-security environments.
We address these challenges by proposing Drone-Mag, which capitalizes on the inherent uniqueness of EM emissions from the flight controller and other electronic components. Specifically, we demonstrate that these emissions are sufficiently unique to distinguish between different brands and models of drones and authenticate individual drones from a pool of identical drones. Additionally, Drone-Mag incorporates a rogue drone detection framework to identify unauthorized drones attempting to impersonate legitimate ones. To validate our approach, we implemented two setups for collecting unintentional EM emissions: a high-precision setup using a spectrum analyzer and a streamlined setup using RTL Software-Defined Radio (SDR) receivers. We conducted extensive experimental evaluations involving 23 drones and flight controllers, including 13 drones with different flight controllers and 10 identical 3DR Solo drones. EM emission samples were collected indoors in a lab environment and outdoors to simulate real-world conditions. Each sample was recorded over 250 ms across eleven 2-MHz frequency bands: 30–32, 32–34, 34–36, 36–38, 40–42, 42–44, 44–46, 46–48, 49–51, 75–77, and 112–114 MHz. Notably, our results indicate that any single 2 MHz bandwidth among these is sufficient to achieve an excellent F1-score, highlighting both the scalability and viability of Drone-Mag. Using a linear Support Vector Machine (SVM) classifier, our system achieved a minimum average F1-score of 0.97 for both brand/model identification and individual drone authentication, utilizing only 35 Fast Fourier Transform (FFT) features across a single 2 MHz bandwidth.
Additionally, our rogue drone detection framework, implemented using autoencoders, achieved an average F1-score of 0.99 with EM samples collected over 250 ms across four 2 MHz frequency bandwidths (30–32, 32–34, 34–36, and 36–38 MHz). Our solution is entirely passive, requiring no access to the drone’s internal logic or firmware. It integrates seamlessly into existing protocols, requires no hardware or software modifications, and is resistant to spoofing due to its reliance on the physical layer properties of the drone’s electronic components. By addressing key technical challenges—including the detection of rogue drones—and demonstrating high performance across multiple scenarios, Drone-Mag offers a robust and effective approach to drone authentication in security-critical environments.
Roadmap. The rest of the article is organized as follows: Section 2 describes the scenario and adversary model; Section 3 describes Drone-Mag in details; Section 4 reports the setup used in Drone-Mag experiments; Section 5 presents an extensive experimental performance assessment; Section 6 discusses some aspects of Drone-Mag; Section 7 reviews the related work with qualitative comparison to Drone-Mag, and, finally, Section 8 concludes the article.
2 Scenario and Adversary Model
Our proposed framework is intended to achieve two main objectives: (i) Different drone brands and flight controllers identification; and (ii) Identical drones and flight controllers authentication.
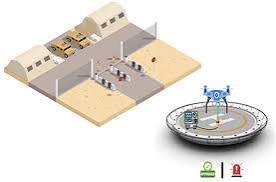
Scenario. We first aim to identify different drone brands and models, equipped with different flight controllers. After that, we aim to authenticate the specific individual drone and flight controller from a group of identical drones. We consider the following scenario: a military base, where drones are sent out in different missions outside the military base. First, all the drones operating from this specific military base (the drones are equipped with different or identical flight controllers) are fingerprinted using the framework described in Section 3. After that, when the drone returns to the base after completing a mission, it has to land on a landing pad placed in a safety zone on the outer skirts of the military base, as shown in Figure 1. This landing pad is equipped with equipment to collect the EM emissions of the drone using a dedicated magnetic probe placed on a predefined test point on the drone, i.e., the same point that was used to fingerprint the drone in the Training Phase. If the real-time collected fingerprint matches the stored profile of this specific drone, the drone is allowed to enter the military base. Otherwise, the drone is subject to further inspections to check if it has been tampered with. While our proposed framework is well-suited for military environments, it can also be applied in civilian and critical infrastructure scenarios. For instance, Drone-Mag could enhance security at airports, where unauthorized drones pose risks to air traffic control and restricted zones. Similarly, it can be used to authenticate drones deployed for industrial inspections of power plants, oil refineries, or smart city surveillance, ensuring that only authorized UAVs operate in sensitive areas and mitigating risks from impersonation or rogue drone intrusions.
Fig. 1.

Drone-Mag scenario.
Adversary Model. We assume that the adversary’s primary objective is to have their drone pass the authentication check at the landing pad, thereby infiltrating the secure zone (e.g., military base or critical infrastructure). The adversary may attempt one or more of the following approaches to achieve this objective:
(1)
Replay and Mimicry Attacks: The adversary may attempt to record the EM emissions of a legitimate drone and replay them to deceive the authentication system, or they may attempt to mimic the target drone’s EM fingerprint by manipulating the software or configurations of their own drone.
(2)
Hardware Tampering: The adversary may attempt to tamper with or replace the internal electronic components (e.g., the flight controller) of a legitimate drone to alter its EM fingerprint. In doing so, the adversary’s goal may not necessarily be to gain entry with the tampered drone but to cause the legitimate drone to fail the authentication process, rendering it unusable for the military base or facility.
(3)
Impersonation with Identical-Looking Drones: The adversary may use a drone that looks identical to a legitimate one (same brand and model) to blend in visually. This impersonation attempt may also involve internal modifications to the electronic components or firmware to make it appear authentic during basic inspections.
3 Drone-Mag Framework
In this section, we provide the details of Drone-Mag, our proposed solution to provide authentication for drones. Specifically, Section 3.1 provides an overview of Drone-Mag, Section 3.2 details the actors involved in Drone-Mag, Section 3.3 lists the modules used in Drone-Mag, while Section 3.4 reports the details of the phases included in Drone-Mag.
3.1 Drone-Mag in a Nutshell
In this article, we explore the potential of exploiting mainly the EM emissions that are unintentionally generated as a consequence of electrical currents flowing through the electronic circuits of drones. The generation of these magnetic fields is primarily governed by the principles of the Biot–Savart Law. This law states that the magnitude of a magnetic field produced by a long conductor carrying current I is expressed as , where is the magnetic constant and r is the distance from the conductor [27].
Figure 2 summarizes our proposed solution Drone-Mag. Essentially, Drone-Mag offers a method for authenticating drones based on their unique EM emissions. The solution first starts by training an autoencoder to detect rogue drones and an SVM model to authenticate drones.
Fig. 2.

Overview of Drone-Mag.
In the first phase, we use a magnetic probe to gather the EM emissions from the drone’s flight controller and ICs while the drone is powered ON but not in flight. In the second phase, we calculate relevant Machine Learning (ML) features based on the collected EM emissions samples. These features serve as input to train or test the autoencoder and SVM models.
When a drone authentication is required, the EM emissions are collected, the relevant features are extracted, and then passed as a test sample to the trained autoencoder model. If the drone successfully passes the autoencoder test, it is recognized as an authorized drone. Otherwise, the drone authentication fails. In cases where individual drone authentication is necessary, the test sample is then evaluated by SVM model specifically trained to differentiate between different authorized drones. If the test sample profile passes this additional test, the authentication process successfully identifies the specific drone. Otherwise, the authentication fails.
3.2 Actors
Overall, Drone-Mag mainly involves the following two entities:
—
Prover: It is a drone belonging to a specific entity.
—
Verifier: It is a system or a device interested in authenticating the prover. To this aim, at the Enrolment Phase, it does the following: (i) record the drone EM emissions; (ii) extract the relevant features and train both an autoencoder and an SVM model; and (iii) store such profiles locally or on a dedicated online server. After that, when authentication of the prover is required, it again records a sample of its EM emissions, extracts the relevant features, and feeds them to the previously trained autoencoder. If the sample is recognized as being produced by an authorized drone, the sample is passed to the trained SVM model for identifying the specific drone. The verifier is assumed to be fitted with the tools required to record the EM emissions and run signal analysis (e.g., an SDR).
3.3 Modules
We define two main modes of operation for Drone-Mag framework:
—
Training Phase: During this step, a Local Database is generated with all approved drone profiles.
—
Classification Phase: This is the online operating phase of Drone-Mag, where a drone is examined to see whether its profile matches the one acquired during the Training Phase.
Overall, Drone-Mag framework consists of five different modules, as depicted in Figure 3:
—
Emissions Extraction Module: This module’s function is to collect and log unintentional EM emissions from a certain drone under test. More details about the equipment used in our experiments will be provided in Section 4.
—
Features Extraction Module: This module is in charge of producing the relevant features from the raw data supplied by the Emissions Extraction Module. This module runs in three distinct stages:
–
Data Normalization: To enable cross-comparisons between different measurements, the Received Signal Strength (RSS) raw data in dBm acquired by the Emissions Extraction Module are normalized to the range.
–
Regions Definition: In the recorded data, each sample of EM emissions RSS in dBm is associated with a specific timestamp and frequency. In this module, we partition each sample of EM emissions into a number of regions, producing a matrix where each region consists of the RSS values collected at a specific range of time and frequency.
–
Features Computation: Starting from the matrix created in the previous step, we compute the features of each defined region.
We consider the following statistical features: (i) mean (); (ii) variance (); (iii) standard deviation (); (iv) kurtosis (); and (v) skewness (), to precisely characterize the unintentional EM emissions from each drone’s electronic components, as per the following equations:
(1)
(2)
(3)
For each region , we construct the features vector by computing those five statistical features:
(4)
The concatenation of different regions features vectors yields the final features vector of 35 statistical features for each sample of magnetic emissions:
(5)
The output of this phase is a matrix of features for the fingerprinted samples of magnetic emissions that is passed either to the Training Module or to the Classification Module, depending on the action required.
(6)
—
Training Module: This module, which is only active in the Training Phase, is in charge of constructing the reference profile for the specific drone under examination by utilizing the features already defined by the Features Extraction Module. The generated profile is saved to the Local Database.
—
Verification Module: This module employs an autoencoder to run a preliminary evaluation of the collected EM sample in order to determine if it originates from a legitimate drone or not. If the verification is successful, the EM sample is passed to the Classification Module to identify the specific drone.
—
Classification Module: This module, which is only active in the Authentication Phase, determines if the previously saved profiles in Local Database match the one obtained in real-time from the device under test. We utilized the one-class linear SVM classifier available in Matlab’s ML Toolbox as the classification algorithm. This module returns a similarity score, which indicates how close the EM emissions recorded in real-time from the device under test to the stored profile.
Fig. 3.

Logical architecture of the Drone-Mag framework.
We employ the following performance evaluation metrics to evaluate the performance of Drone-Mag:
—
Accuracy (ACC): Represents the overall correctness of a classifier’s predictions by measuring the ratio of correctly classified instances to the total instances.
(7)
—
Area Under the Curve (AUC): Represents the area under the Receiver Operating Characteristic curve, which quantifies a classifier’s ability to distinguish classes.
—
Precision (Pr): Measures the accuracy of positive predictions by indicating the ratio of True Positives (TPs) to all predicted positives (TP + FP).
(8)
—
Recall (Re): Measures the ability of a classifier to identify all positive instances correctly by indicating the ratio of TPs to all actual positives (TP + FN).
(9)
—
F1-score: The F1-score is the harmonic mean of precision (Pr) and recall (Re).
(10)
3.4 Phases of Drone-Mag
Drone-Mag includes two main phases, namely, the Enrolment Phase and the Authentication Phase, detailed in the following.
—
Enrolment Phase: Figure 4(a) shows the sequence diagram of the Enrolment Phase. Before deployment, the verifier collects the EM emissions of the prover for a specific time window using the Emissions Extraction Module. For each sample collected, the verifier computes the relevant features of the recorded EM emissions using the Features Extraction Module, trains an autoencoder and an SVM model using the Training Module, and saves the trained model locally or on an online database.
—
Authentication Phase: The Authentication Phase steps are detailed in Figure 4(b). Upon any authentication exchange, the verifier records the EM emissions emitted from the prover using the Emissions Extraction Module and fingerprints them via the Features Extraction Module to extract the relevant features. After that, using the Verification Module, the verifier checks first if the model of the features just computed belongs to a legitimate drone in the trained model using the trained autoencoder. If it is recognized as a legitimate drone, the Classification Module determines exactly which drone produced the EM emissions sample under test, and the drone is authenticated. Otherwise, authentication fails.
Fig. 4.

Sequence diagrams of the Enrolment and Authentication Phases of Drone-Mag.
4 Experimental Setup
In the following, we list the equipment and tools used in our experimental setup.
—
Drones: We tested the performance of Drone-Mag with a set of 23 drones including 13 different drones, each equipped with a different flight controller board to test the ability of Drone-Mag in distinguishing different drones, and 10 identical 3DR Solo drones to evaluate Drone-Mag performance in uniquely identifying identical drones leveraging the non-idealities present even between identical electronic components. The list of different drones and flight controllers tested is summarized in Tables 1–3.
—
Aaronia PBS2 EMC Probe Set: We utilized the Aaronia PBS2 EMC Probe set [1] to capture the unintentional EM emissions generated by the drones. This equipment enables simple pinpointing and measuring of emissions from the electronic components in the frequency range from DC (1 Hz) to 9 GHz. We used the 25 mm magnetic (H) field probe PBS-H3 probe to collect the EM emissions from the drones. It has an insulating layer that provides a safe measuring environment for oscillators and different electronic components. This probe is connected to the UBBV2 40dB EMC RF pre-amplifier, which allows for a clear separation of the relevant signal from the background noise. The probe is then connected to the spectrum analyzer or RTL-SDR through a low-impedance cable.
—
Rohde & Schwarz FSW8 Spectrum Analyzer: The Rohde & Schwarz FSW8 Spectrum Analyzer was utilized to capture the unintentional EM emissions from the magnetic Probe across a 200 MHz frequency bandwidth. This equipment automatically translates raw data into power spectral density measurements by executing an FFT over the recorded samples, and it produces a tuple for each time frame with (among other features) a timestamp (in milliseconds), a frequency (in Hz), and a power level (in dBm).
—
RTL-SDR: In our experiments, we also designed a more compact and cheap emissions collection setup by employing the RTL-SDR instead of the expensive Rohde & Schwarz FSW8 Spectrum Analyzer. This was done in order to decrease the cost and increase the portability of the setup. The RTL-SDR was connected to a magnetic probe and used to measure EM emissions within a 2 MHz frequency bandwidth, e.g., from 30 to 32 MHz. The device collects raw IQ samples which are then converted to values of power spectral density in dBm. This is done by using the FFT method on the collected data, with a step of 125 Hz and 2 MHz range, resulting in 16,000 frequency points and their corresponding power levels in dBm.
—
Matlab R2024a: Matlab R2024a was used to implement the Features Extraction Module, the Training Module, the Local Database, and the Classification Module.
Table 1.
| Drone ID | Flight controller | Count |
|---|---|---|
| 1 | Pixhawk 2.0 | 10 |
| 2 | MATEKSYS F722 | 1 |
| 3 | Flywoo GOKU HDF4 EVO F4 | 1 |
| 4 | FlightOne SKITZO Revolt OSD Lite F4 | 1 |
| 5 | HGLRC Zeus F722 3-6S | 1 |
| 6 | Racerstar StarF4S 30A Blheli_S Dshot | 1 |
List of Flight Controllers Installed on Drones Used in Drone-Mag Experiments
Table 2.
| Parameter | Description |
|---|---|
| Encoder layers | Four dense layers |
| Decoder layers | Three dense layers |
| Encoder activation | ReLU |
| Decoder activation | ReLU (first two layers), Sigmoid (last layer) |
| Optimizer | Adam |
| Epochs and batch size | 50 |
| Standardize data | True |
Autoencoder Parameters
Table 3.
| Drone ID | Flight controller | Count |
|---|---|---|
| 1 | Pixhawk 2.0 | 10 |
| 2 | Hobbywing F7 | 1 |
| 3 | Holybro F722 Kakute | 1 |
| 4 | T-Motor Velox F7 | 1 |
| 5 | SpeedyBee F405 V4 | 1 |
| 6 | iFlight BLITZ F745 V1.1 | 1 |
| 7 | BrainFPV Radix 2 H7 | 1 |
| 8 | Skystars H743 HD | 1 |
| 9 | SpeedyBee F7 V3 | 1 |
List of Drones and Flight Controllers Used in Outdoor Drone-Mag Experiments
Table 1 provides a list of the flight controllers used to evaluate the performance of Drone-Mag.
4.1 Spectrum Analyzer Setup
All of the tests reported in the following were carried out under standard laboratory conditions across 3 days by collecting the unintentional EM emissions emitted by the target drone under test, with no attempt made to decrease background noise. It is worth emphasizing that the magnetic probe we utilize is a near-field probe, which primarily records EM emissions from a close range around the probe, which enables the most effective noise reduction from the surrounding environment. We collect the EM emissions across 11 different 2 MHz frequency bandwidths, i.e., 30–32, 32–34, 34–36, 36–38, 40–42, 42–44, 44–46, 46–48, 49–51, 75–77, and 112–114 MHz. Our spectrum analyzer experimental setup is shown in Figure 5(a).
Fig. 5.

Measurement setups.
Note that we just switch the drone ON, then start collecting the EM emissions using the described setup. The drone is idle with the motors and propellers switched OFF, so the unintentional EM emissions collected are related to the powered ON state of the drone’s electronic components without performing any specific function or movement.
4.2 RTL-SDR Setup
In this section, we reduce the form factor of the experimental setup for Drone-Mag, using cheap Commercial off-the-shelf RTL-SDR instead of the spectrum analyzer to collect the EM emissions captured by the magnetic probe, as shown in Figure 5(b). We select four 2 MHz frequency bandwidths: 30–32, 32–34, 34–36, and 36–38 MHz to test the performance of Drone-Mag.
5 Experimental Results
In the following, we provide several experimental results obtained using both the spectrum analyzer and the RTL-SDR setups previously described.
5.1 Power Spectral Density of Drones
We first evaluate the profile of unintentional EM emissions generated by different drone flight controllers when the drone is switched ON but not flying. We considered six different drone flight controllers as summarized in Table 1.
Figure 6(a) shows the power spectral density of the unintentional EM emissions of the full 200 MHz bandwidth acquired by the spectrum analyzer from the 6 different flight controllers under test, and Figure 6(b) shows the 10 identical Solo drones considered for evaluating the performance of Drone-Mag, respectively. Each trace in the cited figures lasts for around 150 ms. Due to the normalization phase executed during the Features Extraction module, all of the unintentional EM emissions RSS samples recorded in dBm are normalized to values in the range between 0 and 1. Specifically, the blue color maps values in the range , the cyan corresponds to values in the range , the yellow color is related to values in the range , while the red color indicates values in the range .
Fig. 6.

Power spectral density of the unintentional EM emissions recorded for around 150 ms with 200 MHz frequency bandwidth for each of the 15 different drone flight controllers considered for testing Drone-Mag, separated by black lines.
While we collect the unintentional EM emissions of each drone flight controller using 200 MHz frequency bandwidth to get a clear insight into their differences as shown in Figure 6(a) and (b), we only consider a 2 MHz fingerprinting bandwidth for drone identification and authentication. We chose four random 2 MHz frequency bandwidths from the EM emissions of the six different drones under test collected using the spectrum analyzer setup shown in Figure 5(a), i.e., 30–32, 49–51, 75–77, and 112–114 MHz; and four consecutive frequency bandwidths, i.e., 30–32, 32–34, 34–46, and 36–38 MHz from the drones’ EM emissions traces collected using the RTL-SDR setup depicted in Figure 5(b), in order to show the scalability of Drone-Mag and its ability to authenticate drones across a wide range of frequency bandwidths. Figure 7(a), (b), (c), and (d) shows the power spectral density of the unintentional EM emissions recorded for the following 2 MHz frequency bandwidths: 30–32, 32–34, 34–46, and 36–38 MHz, respectively. In addition, Figure 8(a)–(c) shows the unintentional EM emissions recorded for the 49–51, 75–77, and 112–114 MHz frequency bandwidths, respectively.
Fig. 7.

Power spectral density of the unintentional EM emissions recorded for around 150 ms with 2 MHz frequency bandwidth, shown across four consecutive frequency windows (30-38 MHz), for each of the six different drone flight controllers considered for testing Drone-Mag, separated by black lines.
Power spectral density of unintentional EM emissions recorded over approximately 150 ms with a 2 MHz bandwidth, shown across four consecutive frequency windows spanning 30–38 MHz. The figure is divided into six sections—each corresponding to a different drone flight controller evaluated in Drone-Mag—separated by black lines.
Fig. 8.

Power spectral density of the unintentional EM emissions recorded for around 150 ms with 2 MHz frequency bandwidth, shown across three scattered frequency windows, for each of the six different drone flight controllers considered for testing Drone-Mag, separated by black lines.
Power spectral density of unintentional EM emissions recorded over approximately 150 ms with a 2 MHz bandwidth, shown across three scattered frequency windows. The figure is divided into six segments-one per drone flight controller considered for testing Drone-Mag-separated by black lines.
5.2 Features Computation
In this section, we detail the features computation process for the EM data collected using both setups: Spectrum Analyzer and RTL-SDR.
5.2.1 Spectrum Analyzer.
In the following, we provide a description of the segmentation and features computation process of the EM emissions traces collected using the spectrum analyzer.
We consider 15 drones in our analysis of the performance of Drone-Mag as detailed in Table 1. We collect 600 samples for each drone and consider a 2 MHz acquisition frequency bandwidth covering the following ranges: 30–32, 49–51, 75–77, and 112–114 MHz. We select those frequencies randomly from the 200 MHz range depicted in Figure 6 to show the scalability of Drone-Mag and its capability to fingerprint and authenticate drones via a large number of frequency bandwidths. This allows for robust authentication of drones, as the system administrator can use an increased number of frequency bandwidths to authenticate drones, i.e., 30–32 and 75–77 MHz samples are used to authenticate a drone. We consider a fixed observation window of around (150 ms) for each sample of each of the collected traces of EM emissions. For the six different drone brands and flight controllers identification, the differences are apparent even to the naked eye, as shown in Figure 6(a). Each time window is further divided into a number of time and frequency regions to compute the following five statistical features over each of them: mean, standard deviation, variance, skewness, and kurtosis. Overall, we considered 35 features generated by computing the five statistical features over each of the seven regions of the EM emissions sample. Specifically, the features are computed as follows: first, we compute the five statistical features over the whole observation window of 150 ms, generating five features. Then, we further divide the observation window of 150 ms into 2 time regions, each 75 ms long, and compute the same 5 statistical features for each of them, resulting in 10 additional features. After that, we further divide each of the time regions resulting from the previous step into two frequency regions, each with a bandwidth of 1 MHz. For each of the frequency regions, we compute the five aforementioned statistical features, generating features. By summing up the three stages, we have a total of features. Those features are used as input to train or test the verification and classification models.
5.2.2 RTL-SDR.
We consider only the 10 identical drones in our reduced experimental setup utilizing the RTL-SDR instead of the spectrum analyzer, as the differences between the EM emissions of different flight controllers are clear even to the naked eye, as shown in Figure 6(a). We collect 600 samples of the EM emissions for each of the 10 identical 3DR Solo drones using the setup illustrated in Figure 5(b). Each sample lasts for 250 ms, spanning 2 MHz frequency bandwidth, covering the following frequency bandwidths (each bandwidth EM emissions are collected separately): 30–32, 32–34, 34–46, 36–38 MHz, with 125 Hz step, resulting in 16,000 FFT points and their RSS values.
5.3 Rogue Drone Detection
In this section, we propose an autoencoder-based solution to check if the EM fingerprint extracted from the drone under analysis belongs to the pool of the EM traces collected from the authorized drones. This step is taken before the identification and Authentication Phase, leaving the other two for further analysis should the drone pass this test. We conducted the experiments within the RTL-SDR reduced form setup as it represents a more efficient and cost-effective setup.
An autoencoder is a type of unsupervised neural network that can learn to compress and encode data efficiently. In addition, it can also learn to reconstruct the data from the compressed representation to a version that closely resembles the original input [16]. An autoencoder can be trained on a dataset built recording the normal expected behavior of some devices, and then it can be used to identify any new devices that deviate from the model built over the cited dataset. This pipeline of actions can be implemented by encoding the profiles of the new drones and comparing them to the encoded representation of the authorized drones. If the encoded representation of the new device is significantly different from the authorized drones’ profiles, it can be flagged as a rogue drone.
Our aim is to test the ability of Drone-Mag to reject rogue drones based on the unique EM emissions profiles. Since the task of classifying identical drones is more challenging than classifying different drones that are distinct even to the naked eye, we consider the 10 identical Solo drones to evaluate Drone-Mag rogue drone detection performance. From the dataset of EM emissions data collected from the 10 identical Solo drones using the minimized setup described in Section 4.2, we build an autoencoder framework, and we use it to train a model utilizing the EM emissions data of 8 out of the 10 identical drones as authorized drones, and we consider the data of the remaining 2 as rogue drones. We use the most relevant 50 FFT points as features out of the 16,000 FFT points collected. The autoencoder architecture used for detecting rogue drones is summarized in Table 2.
In Figure 9, we plot the Mean Squared Error (MSE) of both the eight authorized drones and the two rogue drones across four frequency bandwidths, i.e., 30–32 MHz in Figure 9(a), 32–34 MHz in Figure 9(b), 34–36 MHz in Figure 9(c), and 36–38 MHz in Figure 9(d). We set a separating threshold between authenticated and rogue drones as follows: 0.005, 0.004, 0.0045, and 0.0027, respectively. The selected threshold used to accept or reject the samples of EM emissions of the drone under test can be adjusted according to the desired system performance, either to increase security and reduce false accept errors, or reduce false reject errors and enhance accessibility. A comprehensive performance analysis for Drone-Mag rogue drone detection is summarized in Figure 10.
Fig. 9.

MSE of the autoencoder in Drone-Mag for detecting rogue drones in four different frequency bandwidths.
Fig. 10.

Drone-Mag autoencoder rogue drone detection performance for different frequency bandwidths.
We use the following performance metrics: Accuracy, Precision, Recall, and F1-score. Drone-Mag has a minimum F1-score of approximately 0.99 for the four frequency bandwidths considered. We chose four consecutive frequency bandwidths, i.e., 30–32, 32–34, 34–36, and 36–38 MHz, and four dispersed ones for the spectrum analyzer setup, i.e., 30–32, 49–51, 75–77, and 112–114 MHz to show that Drone-Mag is scalable and can work across a wide range of frequency bandwidths.
5.4 Classification Results
This step is performed only if the drone passes the verification test carried out by the rogue drone detection autoencoder framework. The classification results for each of the two main objectives illustrated in Section 2 are detailed in the following.
5.4.1 Spectrum Analyzer Setup.
For the EM emissions collected using the spectrum analyzer, we obtain the following classification results.
We test on 600 samples of the unintentional EM emissions for each of the 15 drones, including 6 different flight controllers and 10 identical Solo drones. Each sample lasts for 10 frames; each frame is around 15 ms, for a total of around 150 ms per sample. Each frame spans a 2 MHz frequency bandwidth, i.e., 30–32, 49–51, 75–77, and 112–114 MHz. The EM emissions are collected when the specific drone is switched ON, and the drone is not flying. We divided those 600 samples into 80% (480 samples) for the training of the SVM ML model, and the remaining 20% (120 samples) are for testing the trained model.
Specifically, we utilize the one-class linear SVM classifier that evaluates each drone as an independent class by developing a profile that matches the features supplied for the unique drone flight controller (or the specific drone from a pool of identical drones). When a test set is presented as input for classification, the one-class linear SVM classifier produces an evaluation score for each input sample. Such an evaluation score reveals whether or not the given input test sample is consistent with the constructed model. This strategy is especially beneficial when the number of potential classes is large, as in the case of drones, and a multi-class classification approach is not appropriate. Also, this technique provides a way to detect drones that have not been seen before by the classification model, as its evaluation score would be below the threshold set for the authorized drones used to train the ML model. We note here that we tested multiple ML algorithms with comparable results. The choice of the specific ML algorithm is flexible, depending on the scenario and resources available to system administrators.
We tested the classification performance of an increasing number of features, i.e., 5, 10, 20, and 35 statistical features, generated as detailed in Section 5.2. We employed performance metrics such as Accuracy, AUC, Precision, Recall, and F1-score for performance evaluation. Figure 11 summarizes the classification performance of the 15 drones across different frequency bandwidths and an increasing number of features. The average F1-score across all 4 frequency bandwidths and 35 features is around 0.99.
Fig. 11.

Classification performance of Drone-Mag for 15 drones using EM emissions samples collected using the spectrum analyzer setup across different frequency bandwidths and an increasing number of features.
5.4.2 Drone-Mag Robustness.
As we detailed in the previous section, we train the SVM ML model on 80% of the collected data and test it using the remaining unseen 20%. This allows us to evaluate the model’s performance on data not seen before during training, providing an assessment of the ML-trained model’s generalization ability.
To further ensure the robustness of the trained ML model, we collected entirely new data traces of EM emissions for each of the 10 identical Solo drones in a separate time instance after 2 weeks from the first collection across 2 days. This new dataset provides a more rigorous way to evaluate the model’s performance, as it has never been used in the initial training and testing phases. In addition, it verifies the robustness of the EM emissions of the drones across different time instances and proves that the trained ML model is not overfitted. Figure 12 summarizes the classification performance when testing the trained ML model with the new dataset of the 10 drones across different frequency bandwidths and 35 statistical features.
Fig. 12.

Drone-Mag classification performance when testing the trained ML model with the new dataset of the 10 drones across different frequency bandwidths.
We can notice a decline in the performance in the 75–77 MHz bandwidth, i.e., from 0.99 F1-score in the initial training and testing phase to 0.86 F1-score when testing on the separately collected dataset. This degradation in performance suggests that some frequency bandwidths are less temporally stable than others, and system administrators of Drone-Mag might have to employ an iterative process to determine the most stable and reliable frequency bandwidths for drone authentication. In addition, Drone-Mag can employ a majority voting strategy with multiple samples from the same or different frequency bandwidths in order to enhance the drone’s authentication process. As each EM emissions sample is only 150 ms long, this approach will incur minimal delay while ensuring the robustness of the authentication process.
5.4.3 RTL-SDR Setup.
Since the EM emissions for the 6 different drone brands and flight controllers are distinct even to the naked eye, as shown in Figure 6(a), we consider only the 10 identical drones in our reduced experimental setup utilizing the RTL-SDR instead of the spectrum analyzer. Using the described setup in Figure 5(b), we collect 600 samples of the EM emissions for each of the 10 identical 3DR Solo drones. Each sample lasts for 250 ms, with 16,000 FFT points and their respective RSS values spanning 2 MHz frequency bandwidth, covering the following frequency bandwidths: 30–32, 32–34, 34–46, 36–38 MHz, with 125 Hz step. As it can be seen from Figure 6, drones’ EM emissions show variations along the whole 200 MHz frequency span, not just in the four frequency bandwidths that we select as examples. For each of the 600 samples, out of the 16,000 sampled FFT points collected, we select an increased number of features, i.e., 5, 10, 20, and 35 FFT points for the classification task of the 10 identical drones. Figure 13 summarizes the classification performance of the 10 identical Solo drones across different frequency bandwidths and number of features.
Fig. 13.

Classification performance of Drone-Mag for 10 identical drones using EM emissions samples collected using the RTL-SDR setup across different frequency bandwidths and number of features.
5.5 Outdoor Experimental Validation
To further validate the robustness and environmental resilience of Drone-Mag, we conducted outdoor experiments by collecting a new set of EM traces from 18 drones and flight controllers under real-world conditions. Our goal is to examine whether Drone-Mag’s classification accuracy, previously validated under controlled laboratory conditions, remains consistent when deployed in outdoor scenarios. We collected EM traces from 10 identical Solo drones and 8 additional flight controllers that had not been tested in prior experiments, as summarized in Table 3. Each drone’s EM emissions were recorded twice: once in an indoor laboratory environment and again in an outdoor setting. This dataset was used to assess whether environmental variations impact classification performance. For the data collection, we selected four 2 MHz frequency bandwidths within the 40–48 MHz range: 40–42, 42–44, 44–46, and 46–48 MHz. Each sample was recorded for 250 ms and captured using 16,000 FFT points, with an FFT resolution step of 125 Hz, effectively spanning 2 MHz per bandwidth. For classification purposes, we extracted 35 of the most relevant FFT points from each sample, ensuring that we retained the most distinguishing features of each drone and flight controller. Our ML model was trained exclusively on the EM traces collected indoors. We then tested the model using the outdoor-collected samples to evaluate its generalization performance in different environmental conditions. The classification results were assessed using five key metrics: Accuracy, AUC, Precision, Recall, and F1-score. As summarized in Figure 14, our results show an average F1-score of 0.9822, 0.9721, 0.9796, 0.9925 for the 40–42 MHz, 42–44 MHz, 44–46 MHz, and 46–48 MHz frequency bandwidths, respectively. These results confirm that the EM fingerprinting approach remains consistent and reliable across both indoor and outdoor environments, achieving near-identical classification accuracy. This finding aligns with prior research [10], which demonstrated that near-field EM emissions are unaffected by environmental factors due to their localized nature. A critical factor in the consistency of our results is the nature of near-field EM emissions, which originate from a drone’s internal electronics rather than its wireless communication modules. Since these emissions are detectable only within a very short range (typically under 5 cm), they are inherently resilient to external interference from environmental Radio Frequency (RF) sources. Moreover, this near-field characteristic enhances the security of Drone-Mag, making it resistant to eavesdropping and replay attacks. An adversary attempting to capture and replay an EM fingerprint would need to place a recording device within 5 cm of the drone’s components, a highly impractical scenario. This property also aligns with our assumed military and critical infrastructure deployment scenarios, where drones are expected to land in designated zones free from external electronic interference at distances of 5–10 cm or more. Additionally, we ensured that the fingerprinting process leveraged unoccupied frequencies within the 40–48 MHz range (and also in the 0–32, 32–34, 34–36, 36–38, 49–51, 75–77, and 112–114 MHz). This choice minimizes interference from widely used communication services such as Wi-Fi or Bluetooth, further improving classification robustness. Moreover, these new indoor and outdoor tests were conducted on a new frequency range that had not been tested before in the previous indoor lab-only experiments detailed in Section 4, further demonstrating the scalability of Drone-Mag across the entire 200 MHz bandwidth, as shown in Figure 6(a). Our outdoor experimental results confirm that Drone-Mag provides robust, environment-independent authentication of drones and flight controllers. The near-field nature of the collected EM emissions ensures consistent classification performance across different operational settings, further strengthening its applicability for high-security environments such as military bases and critical infrastructure. The ability to maintain over 0.97 F1-score outdoors validates the feasibility of real-world deployment, reinforcing the scalability and reliability of the Drone-Mag authentication framework. In addition to our outdoor experiments, prior studies on EM fingerprinting of laptops and mobile phones [10, 29] have investigated the effects of different locations, times, and temperatures on EM fingerprints. These studies found that the fingerprints remain consistent across different locations and time instances, while temperature variations affect the fingerprints only after crossing a specific threshold. In our case, the primary operational scenario is a military base or similarly controlled environment, where such environmental factors can be maintained within acceptable bounds, ensuring consistent fingerprinting during each authentication instance.
Fig. 14.

Drone-Mag classification performance when testing the indoor trained ML model with the outdoor collected dataset of the 18 drones across different frequency bandwidths.
6 Discussion
In the following, we discuss some aspects of our proposed solution Drone-Mag.
6.1 Spectrum Analyzer vs. RTL-SDR Setup
When comparing the classification performance of Drone-Mag using EM emissions samples collected using the spectrum analyzer and RTL-SDR, we can see that they produce comparable results. However, the spectrum analyzer setup requires less sample time length of 150 ms compared to 250 ms for the EM samples collected using the RTL-SDR setup. In addition, the spectrum analyzer can collect the EM emissions from the drones over a wider frequency bandwidth of up to 2 GHz compared to around 3 MHz for the RTL-SDR. However, the RTL-SDR is much cheaper and portable than the spectrum analyzer. The system administrator can decide on which setup to deploy based on the system requirements and available resources.
6.2 Drone-Mag Scalability
We acknowledge that the relatively simple models employed in Drone-Mag—such as the SVM and autoencoder—may face limitations when scaled to accommodate thousands or tens of thousands of UAVs. As the dataset size increases, computational overhead, memory requirements, and training times can also increase. However, the simplicity of these models was chosen to fit the current dataset and ensure real-time performance without the need for extensive computational resources.
For larger datasets, more complex models or alternative architectures, such as convolutional neural networks or transformer-based models, may be employed to maintain scalability and accuracy. These architectures are known for their ability to handle larger feature spaces and complex datasets while maintaining robust performance. However, for the size and nature of our current dataset, these more complex models are not necessary, as the SVM and autoencoder have demonstrated excellent performance with minimal computational overhead.
In addition to the previous point of adopting more complex ML models for larger datasets, several strategies can be employed to enhance Drone-Mag’s scalability to accommodate an increasing number of drones:
—
Sample Duration: In our current implementation, each recorded EM emissions sample is only 250 ms long and spans a 2 MHz frequency bandwidth, which is sufficient for drone brand and flight controller identification as well as identical drone authentication. This sampling period can be extended beyond 250 ms to further accommodate an increasing number of drones and be able to distinguish their differences more clearly. Additionally, multiple samples can be used in conjunction with majority voting to enhance accuracy.
—
Majority Voting for Authentication: Instead of relying on a single 250 ms sample for authentication, the system can utilize multiple samples and apply majority voting. For instance, using three samples, if at least two confirm authentication, the drone is authenticated. This approach reduces false positives and negatives, improving robustness while increasing authentication delay.
—
Frequency Bandwidth Optimization: We have tested Drone-Mag’s performance across multiple frequency bandwidths (30–32, 32–34, 34–36, 36–38, 40–42, 42–44, 44–46, 46–48, 49–51, 75–77, and 112–114 MHz), achieving excellent performance. However, the recorded 200 MHz frequency bandwidth shows variations in EM emissions that can be further utilized, as shown in Figure 6. By optimizing the selection of specific bandwidths, the system can accommodate more drones without significantly increasing computational demands. Additionally, instead of relying on a single 2 MHz bandwidth per sample, multiple 2 MHz bands can be used simultaneously to improve robustness and scale to an increased number of drones.
—
Feature Selection: In our RTL-SDR-based setup, each sample is 250 ms long and spans 2 MHz, but we use only 35 FFT points as features for the classification task and 50 FFT points for rogue drone detection, out of a total of 16,000 FFT points. This represents only about 0.3% of the total recorded spectrum. By selecting different FFT point groups or combining multiple groups, the system administrator can increase the number of identifiable drones or ensure a more robust authentication process without needing a complete model retraining. Furthermore, the total number of FFT points can be increased—for example, from 16,000 to 32,000—allowing for finer granularity and higher precision in feature extraction, improving discrimination between a larger number of drones.
6.3 Drone-Mag Proximity as a Security Advantage
While the close proximity requirement for Drone-Mag may seem like a limitation, it actually provides a significant security advantage. Since Drone-Mag utilizes a near-field EM probe, the adversary must be in extremely close physical proximity (within a few centimeters) to the drone to successfully record its EM emissions for a potential replay attack. In practice, this is highly unlikely due to the secure and monitored nature of the areas where drones undergo authentication (e.g., military bases, airports, critical infrastructure). Unlike acoustic or vision-based authentication methods, which can be eavesdropped from the far-field using basic recording devices, Drone-Mag’s near-field requirement makes it nearly impossible for an adversary to passively capture the EM emissions without being detected. In addition, the adversary would also need to get very close to the authentication pad to replay the recorded emissions effectively, adding an additional layer of security.
6.4 Re-Fingerprinting and PLA
It is well established that EM and RF-based authentication methods may require periodic re-fingerprinting to account for changes over time. This issue is common across physical-layer fingerprinting methods [28], as demonstrated in prior research:
—
Maes and Van Der Leest [36] discussed how silicon aging, such as Negative Bias Temperature Instability, can impact SRAM Physical Unclonable Function (PUF) reliability, requiring periodic recalibration.
—
Guo et al. [15] highlighted that aging-induced unreliability in SRAM PUFs necessitates periodic fingerprint updates to maintain accuracy.
—
For Drone-Mag, we acknowledge that over extended periods (like other physical-layer fingerprinting solutions), electronic components may experience gradual changes that can affect the EM fingerprint. To address this, we propose a fingerprint slow updating technique, as described in prior studies on physical-layer fingerprinting [10]. This approach involves periodically updating the fingerprints in the database if the current fingerprint is still classified as belonging to the legitimate drone but shows a small, consistent offset due to slow changes. This compensation mechanism ensures that gradual feature drifts caused by hardware aging do not impact the overall authentication accuracy. Additionally, in our specific scenario involving military bases and critical infrastructures, drones typically undergo routine checkups during landing after missions. During these checkups, additional EM samples can be collected to reinforce the existing fingerprint profile. This allows the fingerprint to evolve over time and incorporate any minor variations in the drone’s EM emissions, effectively strengthening the model through continuous feedback. This enforcement process ensures that the system remains robust over the lifespan of the drone without requiring significant operational changes.
6.5 Impersonation Attack
Impersonation or mimicry attacks involve attempting to imitate the EM fingerprint of a target device by manipulating the software or configurations of a similar device. However, the fundamental discrepancies in EM fingerprints originate from the physical hardware (e.g., the flight controller’s electronic components). Manipulating the software or settings of an attack device may alter its EM fingerprint, but it is nearly impossible to make it identical to the target drone’s fingerprint due to the hardware-dependent nature of the emissions—as commonly assumed in the literature [9, 25]. Studies [10] have shown that the hardware-level variations are subtler yet more defining than the variations caused by software configurations, making successful mimicry highly unlikely.
6.6 Replay Attack
Unlike other physical-layer fingerprinting techniques such as acoustic or vision, Drone-Mag relies on a near-field EM probe that only detects emissions within close proximity. Hence, in order to record/replay the EM emissions of a specific drone, an adversary would need to get extremely close to the drone during the fingerprinting process. In our scenario, this process typically occurs within a restricted and secure area, such as a military base, airport, or critical infrastructure facility. These locations have stringent security protocols, making it difficult for an adversary to access the authentication area and record/replay the EM fingerprint of a legitimate drone. Furthermore, even if an adversary intercepts the drone outside of the secure zone (e.g., military infrastructure, airports, or other critical locations) and manages to record its EM emissions from near-field proximity, they would still need to enter the secure zone and be in close proximity to the authentication system to conduct a replay attack. Given the controlled nature of such environments and the security measures in place, this adds an additional layer of protection against replay attacks.
6.7 Drone Firmware Modification Detection
For most commercial drones, changing the drone’s firmware is fairly simple. However, in the case of military or classified drones considered in the scenario detailed in Section 2, manipulating the firmware might be protected by hardware or software techniques [32, 57]. Nevertheless, as proven in [26], the firmware modifications can be detected leveraging ICs EM emissions.
7 Related Work
We can divide the EM fingerprinting contributions into two main categories: (i) electronic components and devices classification and (ii) codes or electronic components activities monitoring. In the following, we summarize some of the relevant contributions to those two topics in addition to discussing existing drone fingerprinting techniques.
Electronic Components and Devices Classification. The feasibility of fingerprinting wireless devices via RF signal non-idealities was first shown in [53]. Later, Cobb et al. [58] linked manufacturing variances in integrated circuits to unique RF characteristics, enabling identification of 40 identical microcontrollers via unintentional emissions. Similarly, Wright [59] identified SCADA sensors and actuators by analyzing emissions during code execution. Authors in [6] exploited unintentional RF emissions to classify IEEE 802.15.4 ZigBee devices in critical infrastructure. Magnetic emissions were also used for fingerprinting devices and antennas [21]. IEEE 802.15.4 emissions helped reject rogue devices in [12]. USB Flash drives were fingerprinted via unintentional EM emissions [26], while [10, 29] leveraged CPU emissions to identify laptops and smartphones. Authors in [62] distinguished smartphone brands and camera statuses via EM emissions. Arduino devices and their software were fingerprinted in [38]. Car fingerprinting via unintended emissions was explored in [14].
Codes or Electronic Components Activities Monitoring. For fingerprinting device activities, Sehatbakhsh et al. [48] introduced EMMA, using EM emissions for attestation. IDEA [30] detected malware in embedded systems via EM analysis. Other malware detection methods include [7, 17, 39, 47, 49]. EM emissions were used as PUF for IoT authentication [23, 25]. Trojan detection via EM sensors was introduced by He et al. [19], while Chaman et al. [8] leveraged EM emissions to detect RF eavesdroppers. Cryptojacking detection via GPU magnetic emissions was proposed by Xiao et al. [60], and Maia et al. [37] inferred neural network topology from GPU power cable flux. Hidden camera detection using EM emissions was explored by Liu et al. [34], and Ramesh et al. [41] estimated laptop microphone status similarly. Jamming detection via magnetic emissions was proposed in [22].
Drone Fingerprinting. A survey of drone detection and classification methods is introduced in [54]. Table 4 provides a qualitative comparison of Drone-Mag against related literature on drone authentication. SoundUAV [42] proposed a solution to fingerprint drones based on their motors’ noise characteristics that are unique due to manufacturing defects. Additional drone acoustic fingerprinting methods are presented in [11, 31, 50, 56]. However, such solutions are susceptible to environmental noises that could disrupt the motors sounds and unique fingerprint, unlike our proposed solution Drone-Mag that leverages the unintentional EM emissions that are collected only from near-field around the drone ICs. In addition, acoustic solutions are unable to detect any adversary tampering with the drone’s electronic hardware. On the other hand, Drone-Mag is based on the EM signature of each individual drone that is tied to the inherent properties of its electronic components. Drone RF fingerprinting has been proposed in [33, 44, 51]. However, RF methods require the drone to have an RF interface and are susceptible to interference and environmental noises in addition to the possibility of signal interception by an adversary. Drone detection and identification using a camera is introduced in [43]. However, it can be spoofed, is susceptible to environmental noises and obstructions, and cannot detect adversary hardware tampering. Authors in [18, 40] discuss radar detection and classification of drones. However, radars cannot distinguish or authenticate identical drones, nor can they detect malicious tampering done to the drone’s electronic components. Authenticating drones via PUF is proposed in [35, 63]. While PUF is one of the few authentication techniques that can detect hardware tampering, they require an interactive communication channel with the drone. Finally, Gyrosfinger [52] investigated the issue of drone fingerprinting, as the researchers utilized gyroscope offset values to distinguish different drones. However, their approach is limited to drones that possess an unencrypted telemetry channel and cannot detect hardware tampering, e.g., a different flight controller is installed in the drone by an adversary. In contrast, Drone-Mag is not reliant on the underlying protocols and can operate on any type of drone, as it exploits the unique unintentional EM emissions produced by the drones ICs.
Table 4.
| Ref. | Auth. Method | Robust to noise | Non- interactive | Only near-field emissions | Hardware tampering detection | Identical drones Auth. | No RF needed |
|---|---|---|---|---|---|---|---|
| [42] | Acoustic | ○ | ● | ○ | ○ | ● | ● |
| [11] | Acoustic | ○ | ● | ○ | ○ | ● | ● |
| [31] | Acoustic | ○ | ● | ○ | ○ | ○ | ● |
| [50] | Acoustic | ○ | ● | ○ | ○ | ○ | ● |
| [56] | Acoustic | ○ | ● | ○ | ○ | ○ | ● |
| [35] | PUF | ● | ○ | ○ | ● | ● | ○ |
| [63] | PUF | ● | ○ | ○ | ● | ● | ○ |
| [51] | RF | ○ | ● | ○ | ○ | ● | ○ |
| [44] | RF | ○ | ● | ○ | ○ | ○ | ○ |
| [33] | RF | ○ | ● | ○ | ○ | ● | ○ |
| [43] | Camera | ○ | ● | ○ | ○ | ● | ● |
| [40] | Radar | ○ | ● | ○ | ○ | ○ | ● |
| [18] | Radar | ○ | ● | ○ | ○ | ○ | ● |
| [52] | Gyroscope | ● | ○ | ○ | ○ | ● | ○ |
| Drone-Mag | EM emissions | ● | ● | ● | ● | ● | ● |
Qualitative Comparison of Drone-Mag against Related Literature on Drone Authentication
The filled-circle symbol indicates that the feature is available, while the empty-circle symbol indicates that the feature is not available.
8 Conclusion
In this article, we introduced Drone-Mag, a physical-layer based UAVs authentication scheme to boost the existing multifactor authentication protocols via exploiting the intrinsic manufacturing variations of the drone’s flight controller and electronic components in the form of its unintentional EM emissions. Drone-Mag is an authentication technique that is privacy-preserving, passive, can detect adversary hardware tampering with the integrated circuitry of the drone, and does not require any hardware or software modification to the existing drones. We conducted an extensive experimental campaign on 23 drones to test three main scenarios: (i) identification of 14 different drones and flight controllers; (ii) authentication of 10 identical drones; and (iii) detection of rogue drones using an autoencoder-based framework. All tasks achieved a minimum average of 0.97 F1-score. Overall, Drone-Mag emerges as an efficient, unique, experimentally proven, viable, and crypto-less solution to authenticate UAVs.