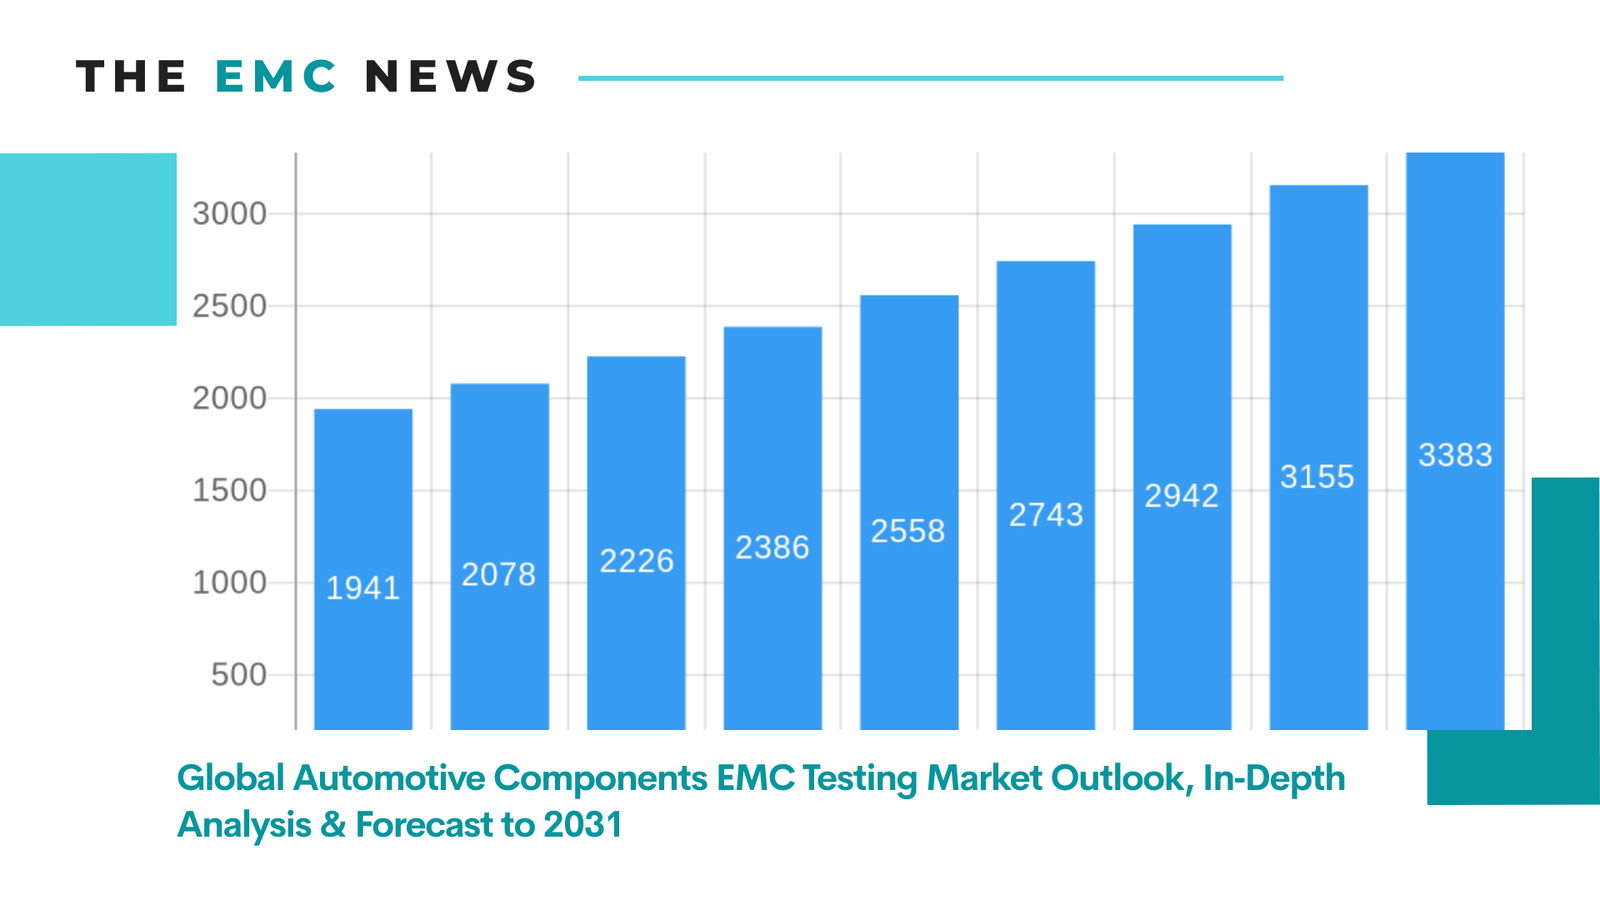
The global Automotive Components EMC Testing market is projected to grow from US$ 1356 million in 2024 to US$ 2638 million by 2031, at a CAGR of 9.7% (2025-2031), driven by critical product segments and diverse end‑use applications.
Automotive Components EMC Testing is the process of evaluating the performance of automotive components in an electromagnetic environment. Its purpose is to ensure that these parts do not generate or suffer electromagnetic interference under normal operation and fault conditions, and to ensure the stability and safety of automotive electronic systems. This type of testing includes radiated emission, immunity, conducted emission and immunity to comply with relevant standards and regulations to ensure that the electromagnetic compatibility of the vehicle meets the expected requirements. Automotive Components EMC Testing Market Size(US$)
M= millions and B=billions
QYRLogo Influenced by factors such as climate change and the rapid advancement of technology, the automotive industry is moving toward four major trends: connected, shared, autonomous, and electric vehicles. These trends are helping to drive the overall growth of automotive electronic components, such as advanced driver-assist systems (ADAS), infotainment systems and vehicle connectivity devices The increasing integration of electronic systems in vehicles and their interaction with portable devices have made the development and validation of automotive products increasingly complex. In order to meet regulatory and industry standards for electromagnetic compatibility (EMC), speed up the validation process and reduce development costs, manufacturers need to evaluate and ensure the reliability, safety and electromagnetic compatibility of electrical and electronic components from the design and concept stage.
The global key companies of Automotive Components EMC Testing include SGS, Bureau Veritas, TUV SUD, Dekra, Intertek Group, UL Solutions, Applus+ Laboratories, Element, and Horiba, etc. In 2024, the global top five players had a share approximately 32% in terms of revenue.
Report Includes: This definitive report equips CEOs, marketing directors, and investors with a 360° view of the global Automotive Components EMC Testing market across value chain. It analyzes historical revenue data (2020–2024) and delivers forecasts through 2031, illuminating demand trends and growth drivers. By segmenting the market by Type and by Application, the study quantifies market size, growth rates, niche opportunities, and substitution risks, and analyzes downstream customers distribution pattern.
Granular regional insights cover five major markets—North America, Europe, APAC, South America, and MEA—with in‑depth analysis of 20+ countries, detailing dominant products, competitive landscape, and downstream demand trends.
Critical competitive intelligence profiles players—revenue, margins, pricing strategies, and major customers—and dissects the top-player positioning across product lines, applications, and regions to reveal strategic strengths.
A concise Industry‑chain overview maps upstream, middlestream, and downstream distribution dynamics to identify strategic gaps and unmet demand.
Market Segmentation Report Metric
Details
Report Title
Global Automotive Components EMC Testing Market Outlook, In‑Depth Analysis & Forecast to 2031
Forecasted Market Size in 2031
US$ 2638 million
CAGR(2025-2031)
9.7%
Market Size Available for Years
2025-2031
Global Automotive Components EMC Testing Companies Covered
SGS
Bureau Veritas
TUV SUD
Dekra
Intertek Group
UL Solutions
Applus+ Laboratories
Element
Horiba
Eurofins MET Labs
SMVIC
CTI
NTEK
Nanjing Rongce Testing Technology
Suzhou NEOtest
Global Automotive Components EMC Testing Market, by Region
North America (U.S., Canada, Mexico)
Europe (Germany, France, UK, Italy, etc.)
Asia Pacific (China, Japan, South Korea, Southeast Asia, India, etc.)
South America (Brazil, etc.)
Middle East and Africa (Turkey, GCC Countries, Africa, etc.)
Global Automotive Components EMC Testing Market, Segment by Type
Interference Testing (EMI)
Immunity Testing (EMS)
Global Automotive Components EMC Testing Market, Segment by Application
Commercial Vehicles
Passenger Vehicles
Forecast Units
Million USD
Report Coverage
Revenue and volume forecast, company share, competitive landscape, growth factors and trends
Chapter Outline Chapter 1: Defines the Automotive Components EMC Testing study scope, segments the market by Type and by Application, etc, highlights segment size and growth potential. Chapter 2: Offers current market state, projects global revenue and sales to 2031, pinpointing high consumption regions and emerging market catalysts Chapter 3: Dissects the player landscape—ranks by revenue and profitability, details Player performance by product type and evaluates concentration alongside M&A moves. Chapter 4: Unlocks high margin product segments—compares revenue, ASP, and technology differentiators, highlighting growth niches and substitution risks Chapter 5: Targets downstream market opportunities—evaluates market size by Application, identifies emerging use cases, and profiles leading customers by region and by Application. Chapter 6: North America—breaks down market size by Type, by Application and country, profiles key players and assesses growth drivers and barriers. Chapter 7: Europe—analyses regional market by Type, by Application and players, flagging drivers and barriers. Chapter 8: Asia Pacific—quantifies market size by Type, by Application, and region/country, profiles top players, and uncovers high potential expansion areas. Chapter 9: Central & South America—measures market size by Type, by Application, and country, profiles top players, and identifies investment opportunities and challenges. Chapter 10: Middle East and Africa—evaluates market size by Type, by Application, and country, profiles key players, and outlines investment prospects and market hurdles Chapter 11: Profiles players in depth—details product specs, revenue, margins; Top-tier players 2024 sales breakdowns by Product type, by Application, by region SWOT analysis, and recent strategic developments. Chapter 12: Industry chain—analyses upstream, cost drivers, plus downstream channels. Chapter 13: Market dynamics—explores drivers, restraints, regulatory impacts, and risk mitigation strategies. Chapter 14: Actionable conclusions and strategic recommendations. Why This Report: Beyond standard market data, this analysis provides a clear profitability roadmap—empowering you to: Allocate capital strategically to high growth regions (Chapters 6–10) and margin rich segments (Chapter 5).
Negotiate from strength with suppliers (Chapter 12) and customers (Chapter 5) using cost and demand intelligence.
Outmaneuver competitors with granular insights into their operations, margins, and strategies (Chapters 3 and 11).
Capitalize on the projected billion‑dollar opportunity with data‑driven regional and segment tactics (Chapter 12-14).
Leverage this 360° intelligence to turn market complexity into actionable competitive advantage. Table of Contents
1 Study Coverage 1.1 Introduction to Automotive Components EMC Testing: Definition, Properties, and Key Attributes 1.2 Market Segmentation by Type 1.2.1 Global Automotive Components EMC Testing Market Size by Type, 2020 VS 2024 VS 2031 1.2.2 Interference Testing (EMI) 1.2.3 Immunity Testing (EMS) 1.3 Market Segmentation by Application 1.3.1 Global Automotive Components EMC Testing Market Size by Application, 2020 VS 2024 VS 2031 1.3.2 Commercial Vehicles 1.3.3 Passenger Vehicles 1.4 Assumptions and Limitations 1.5 Study Objectives 1.6 Years Considered 2 Executive Summary 2.1 Global Automotive Components EMC Testing Revenue Estimates and Forecasts 2020-2031 2.2 Global Automotive Components EMC Testing Revenue by Region 2.2.1 Revenue Comparison: 2020 VS 2024 VS 2031 2.2.2 Historical and Forecasted Revenue by Region (2020-2031) 2.2.3 Global Revenue Market Share by Region (2020-2031) 2.2.4 Emerging Market Focus: Growth Drivers & Investment Trends 3 Competition by Players 3.1 Global Automotive Components EMC Testing Player Revenue Rankings and Profitability 3.1.1 Global Revenue (Value) by Players (2020-2025) 3.1.2 Global Key Player Revenue Ranking (2023 vs. 2024) 3.1.3 Revenue-Based Tier Segmentation (Tier 1, Tier 2, and Tier 3) 3.1.4 Gross Margin by Top Player (2020 VS 2024) 3.2 Global Automotive Components EMC Testing Companies Headquarters and Service Footprint 3.3 Main Product Type Market Size by Players 3.3.1 Interference Testing (EMI) Market Size by Players 3.3.2 Immunity Testing (EMS) Market Size by Players 3.4 Global Automotive Components EMC Testing Market Concentration and Dynamics 3.4.1 Global Market Concentration (CR5 and HHI) 3.4.2 Entrant/Exit Impact Analysis 3.4.3 Strategic Moves: M&A, Expansion, R&D Investment 4 Global Product Segmentation Analysis 4.1 Global Automotive Components EMC Testing Revenue Trends by Type 4.1.1 Global Historical and Forecasted Revenue by Type (2020-2031) 4.1.2 Global Revenue Market Share by Type (2020-2031) 4.2 Key Product Attributes and Differentiation 4.3 Subtype Dynamics: Growth Leaders, Profitability and Risk 4.3.1 High-Growth Niches and Adoption Drivers 4.3.2 Profitability Hotspots and Cost Drivers 4.3.3 Substitution Threats 5 Global Downstream Application Analysis 5.1 Global Automotive Components EMC Testing Revenue by Application 5.1.1 Global Historical and Forecasted Revenue by Application (2020-2031) 5.1.2 Revenue Market Share by Application (2020-2031) 5.1.3 High-Growth Application Identification 5.1.4 Emerging Application Case Studies 5.2 Downstream Customer Analysis 5.2.1 Top Customers by Region 5.2.2 Top Customers by Application 6 North America 6.1 North America Market Size (2020-2031) 6.2 North America Key Players Revenue in 2024 6.3 North America Automotive Components EMC Testing Market Size by Type (2020-2031) 6.4 North America Automotive Components EMC Testing Market Size by Application (2020-2031) 6.5 North America Growth Accelerators and Market Barriers 6.6 North America Automotive Components EMC Testing Market Size by Country 6.6.1 North America Revenue Trends by Country 6.6.2 US 6.6.3 Canada 6.6.4 Mexico 7 Europe 7.1 Europe Market Size (2020-2031) 7.2 Europe Key Players Revenue in 2024 7.3 Europe Automotive Components EMC Testing Market Size by Type (2020-2031) 7.4 Europe Automotive Components EMC Testing Market Size by Application (2020-2031) 7.5 Europe Growth Accelerators and Market Barriers 7.6 Europe Automotive Components EMC Testing Market Size by Country 7.6.1 Europe Revenue Trends by Country 7.6.2 Germany 7.6.3 France 7.6.4 U.K. 7.6.5 Italy 7.6.6 Russia 8 Asia-Pacific 8.1 Asia-Pacific Market Size (2020-2031) 8.2 Asia-Pacific Key Players Revenue in 2024 8.3 Asia-Pacific Automotive Components EMC Testing Market Size by Type (2020-2031) 8.4 Asia-Pacific Automotive Components EMC Testing Market Size by Application (2020-2031) 8.5 Asia-Pacific Growth Accelerators and Market Barriers 8.6 Asia-Pacific Automotive Components EMC Testing Market Size by Region 8.6.1 Asia-Pacific Revenue Trends by Region 8.7 China 8.8 Japan 8.9 South Korea 8.10 Australia 8.11 India 8.12 Southeast Asia 8.12.1 Indonesia 8.12.2 Vietnam 8.12.3 Malaysia 8.12.4 Philippines 8.12.5 Singapore 9 Central and South America 9.1 Central and South America Market Size (2020-2031) 9.2 Central and South America Key Players Revenue in 2024 9.3 Central and South America Automotive Components EMC Testing Market Size by Type (2020-2031) 9.4 Central and South America Automotive Components EMC Testing Market Size by Application (2020-2031) 9.5 Central and South America Investment Opportunities and Key Challenges 9.6 Central and South America Automotive Components EMC Testing Market Size by Country 9.6.1 Central and South America Revenue Trends by Country (2020 VS 2024 VS 2031) 9.6.2 Brazil 9.6.3 Argentina 10 Middle East and Africa 10.1 Middle East and Africa Market Size (2020-2031) 10.2 Middle East and Africa Key Players Revenue in 2024 10.3 Middle East and Africa Automotive Components EMC Testing Market Size by Type (2020-2031) 10.4 Middle East and Africa Automotive Components EMC Testing Market Size by Application (2020-2031) 10.5 Middle East and Africa Investment Opportunities and Key Challenges 10.6 Middle East and Africa Automotive Components EMC Testing Market Size by Country 10.6.1 Middle East and Africa Revenue Trends by Country (2020 VS 2024 VS 2031) 10.6.2 GCC Countries 10.6.3 Israel 10.6.4 Egypt 10.6.5 South Africa 11 Corporate Profile 11.1 SGS 11.1.1 SGS Corporation Information 11.1.2 SGS Business Overview 11.1.3 SGS Automotive Components EMC Testing Product Features and Attributes 11.1.4 SGS Automotive Components EMC Testing Revenue and Gross Margin (2020-2025) 11.1.5 SGS Automotive Components EMC Testing Revenue by Product in 2024 11.1.6 SGS Automotive Components EMC Testing Revenue by Application in 2024 11.1.7 SGS Automotive Components EMC Testing Revenue by Geographic Area in 2024 11.1.8 SGS Automotive Components EMC Testing SWOT Analysis 11.1.9 SGS Recent Developments 11.2 Bureau Veritas 11.2.1 Bureau Veritas Corporation Information 11.2.2 Bureau Veritas Business Overview 11.2.3 Bureau Veritas Automotive Components EMC Testing Product Features and Attributes 11.2.4 Bureau Veritas Automotive Components EMC Testing Revenue and Gross Margin (2020-2025) 11.2.5 Bureau Veritas Automotive Components EMC Testing Revenue by Product in 2024 11.2.6 Bureau Veritas Automotive Components EMC Testing Revenue by Application in 2024 11.2.7 Bureau Veritas Automotive Components EMC Testing Revenue by Geographic Area in 2024 11.2.8 Bureau Veritas Automotive Components EMC Testing SWOT Analysis 11.2.9 Bureau Veritas Recent Developments 11.3 TUV SUD 11.3.1 TUV SUD Corporation Information 11.3.2 TUV SUD Business Overview 11.3.3 TUV SUD Automotive Components EMC Testing Product Features and Attributes 11.3.4 TUV SUD Automotive Components EMC Testing Revenue and Gross Margin (2020-2025) 11.3.5 TUV SUD Automotive Components EMC Testing Revenue by Product in 2024 11.3.6 TUV SUD Automotive Components EMC Testing Revenue by Application in 2024 11.3.7 TUV SUD Automotive Components EMC Testing Revenue by Geographic Area in 2024 11.3.8 TUV SUD Automotive Components EMC Testing SWOT Analysis 11.3.9 TUV SUD Recent Developments 11.4 Dekra 11.4.1 Dekra Corporation Information 11.4.2 Dekra Business Overview 11.4.3 Dekra Automotive Components EMC Testing Product Features and Attributes 11.4.4 Dekra Automotive Components EMC Testing Revenue and Gross Margin (2020-2025) 11.4.5 Dekra Automotive Components EMC Testing Revenue by Product in 2024 11.4.6 Dekra Automotive Components EMC Testing Revenue by Application in 2024 11.4.7 Dekra Automotive Components EMC Testing Revenue by Geographic Area in 2024 11.4.8 Dekra Automotive Components EMC Testing SWOT Analysis 11.4.9 Dekra Recent Developments 11.5 Intertek Group 11.5.1 Intertek Group Corporation Information 11.5.2 Intertek Group Business Overview 11.5.3 Intertek Group Automotive Components EMC Testing Product Features and Attributes 11.5.4 Intertek Group Automotive Components EMC Testing Revenue and Gross Margin (2020-2025) 11.5.5 Intertek Group Automotive Components EMC Testing Revenue by Product in 2024 11.5.6 Intertek Group Automotive Components EMC Testing Revenue by Application in 2024 11.5.7 Intertek Group Automotive Components EMC Testing Revenue by Geographic Area in 2024 11.5.8 Intertek Group Automotive Components EMC Testing SWOT Analysis 11.5.9 Intertek Group Recent Developments 11.6 UL Solutions 11.6.1 UL Solutions Corporation Information 11.6.2 UL Solutions Business Overview 11.6.3 UL Solutions Automotive Components EMC Testing Product Features and Attributes 11.6.4 UL Solutions Automotive Components EMC Testing Revenue and Gross Margin (2020-2025) 11.6.5 UL Solutions Recent Developments 11.7 Applus+ Laboratories 11.7.1 Applus+ Laboratories Corporation Information 11.7.2 Applus+ Laboratories Business Overview 11.7.3 Applus+ Laboratories Automotive Components EMC Testing Product Features and Attributes 11.7.4 Applus+ Laboratories Automotive Components EMC Testing Revenue and Gross Margin (2020-2025) 11.7.5 Applus+ Laboratories Recent Developments 11.8 Element 11.8.1 Element Corporation Information 11.8.2 Element Business Overview 11.8.3 Element Automotive Components EMC Testing Product Features and Attributes 11.8.4 Element Automotive Components EMC Testing Revenue and Gross Margin (2020-2025) 11.8.5 Element Recent Developments 11.9 Horiba 11.9.1 Horiba Corporation Information 11.9.2 Horiba Business Overview 11.9.3 Horiba Automotive Components EMC Testing Product Features and Attributes 11.9.4 Horiba Automotive Components EMC Testing Revenue and Gross Margin (2020-2025) 11.9.5 Horiba Recent Developments 11.10 Eurofins MET Labs 11.10.1 Eurofins MET Labs Corporation Information 11.10.2 Eurofins MET Labs Business Overview 11.10.3 Eurofins MET Labs Automotive Components EMC Testing Product Features and Attributes 11.10.4 Eurofins MET Labs Automotive Components EMC Testing Revenue and Gross Margin (2020-2025) 11.10.5 Company Ten Recent Developments 11.11 SMVIC 11.11.1 SMVIC Corporation Information 11.11.2 SMVIC Business Overview 11.11.3 SMVIC Automotive Components EMC Testing Product Features and Attributes 11.11.4 SMVIC Automotive Components EMC Testing Revenue and Gross Margin (2020-2025) 11.11.5 SMVIC Recent Developments 11.12 CTI 11.12.1 CTI Corporation Information 11.12.2 CTI Business Overview 11.12.3 CTI Automotive Components EMC Testing Product Features and Attributes 11.12.4 CTI Automotive Components EMC Testing Revenue and Gross Margin (2020-2025) 11.12.5 CTI Recent Developments 11.13 NTEK 11.13.1 NTEK Corporation Information 11.13.2 NTEK Business Overview 11.13.3 NTEK Automotive Components EMC Testing Product Features and Attributes 11.13.4 NTEK Automotive Components EMC Testing Revenue and Gross Margin (2020-2025) 11.13.5 NTEK Recent Developments 11.14 Nanjing Rongce Testing Technology 11.14.1 Nanjing Rongce Testing Technology Corporation Information 11.14.2 Nanjing Rongce Testing Technology Business Overview 11.14.3 Nanjing Rongce Testing Technology Automotive Components EMC Testing Product Features and Attributes 11.14.4 Nanjing Rongce Testing Technology Automotive Components EMC Testing Revenue and Gross Margin (2020-2025) 11.14.5 Nanjing Rongce Testing Technology Recent Developments 11.15 Suzhou NEOtest 11.15.1 Suzhou NEOtest Corporation Information 11.15.2 Suzhou NEOtest Business Overview 11.15.3 Suzhou NEOtest Automotive Components EMC Testing Product Features and Attributes 11.15.4 Suzhou NEOtest Automotive Components EMC Testing Revenue and Gross Margin (2020-2025) 11.15.5 Suzhou NEOtest Recent Developments 12 Automotive Components EMC TestingIndustry Chain Analysis 12.1 Automotive Components EMC Testing Industry Chain 12.2 Upstream Analysis 12.2.1 Upstream Key Suppliers 12.3 Middlestream Analysis 12.4 Downstream Sales Model and Distribution Networks 12.4.1 Sales Channels 12.4.2 Distributors 13 Automotive Components EMC Testing Market Dynamics 13.1 Industry Trends and Evolution 13.2 Market Growth Drivers and Emerging Opportunities 13.3 Market Challenges, Risks, and Restraints 14 Key Findings in the Global Automotive Components EMC Testing Study 15 Appendix 15.1 Research Methodology 15.1.1 Methodology/Research Approach 15.1.1.1 Research Programs/Design 15.1.1.2 Market Size Estimation 15.1.1.3 Market Breakdown and Data Triangulation 15.1.2 Data Source 15.1.2.1 Secondary Sources 15.1.2.2 Primary Sources 15.2 Author Details Table of Figures
List of Tables Table 1. Global Automotive Components EMC Testing Market Size Growth Rate by Type, 2020 VS 2024 VS 2031 (US$ Million) Table 2. Global Automotive Components EMC Testing Market Size Growth Rate by Application, 2020 VS 2024 VS 2031 (US$ Million) Table 3. Global Automotive Components EMC Testing Revenue Grow Rate (CAGR) by Region: 2020 VS 2024 VS 2031 (US$ Million) Table 4. Global Automotive Components EMC Testing Revenue by Region (2020-2025) & (US$ Million) Table 5. Global Automotive Components EMC Testing Revenue by Region (2026-2031) & (US$ Million) Table 6. Emerging Market Revenue Grow Rate (CAGR) by Country (2020 VS 2024 VS 2031) (US$ Million) Table 7. Global Automotive Components EMC Testing Revenue by Players (2020-2025) & (US$ Million) Table 8. Global Automotive Components EMC Testing Revenue Market Share by Players (2020-2025) Table 9. Global Key Players’Ranking Shift (2023 vs. 2024) (Based on Revenue) Table 10. Global Automotive Components EMC Testing by Player Tier (Tier 1, Tier 2, and Tier 3) & (based on the Revenue in Automotive Components EMC Testing as of 2024) Table 11. Global Automotive Components EMC Testing Average Gross Margin (%) by Player (2020 VS 2024) Table 12. Global Automotive Components EMC Testing Companies Headquarters Table 13. Global Automotive Components EMC Testing Market Concentration Ratio (CR5 and HHI) Table 14. Key Market Entrant/Exit (2020-2024) – Drivers & Impact Analysis Table 15. Key Mergers & Acquisitions, Expansion Plans, R&D Investment Table 16. Global Automotive Components EMC Testing Revenue by Type (2020-2025) & (US$ Million) Table 17. Global Automotive Components EMC Testing Revenue by Type (2026-2031) & (US$ Million) Table 18. Key Product Attributes and Differentiation Table 19. Global Automotive Components EMC Testing Revenue by Application (2020-2025) & (US$ Million) Table 20. Global Automotive Components EMC Testing Revenue by Application (2026-2031) & (US$ Million) Table 21. Automotive Components EMC Testing High-Growth Sectors Demand CAGR (2024-2031) Table 22. Top Customers by Region Table 23. Top Customers by Application Table 24. North America Automotive Components EMC Testing Growth Accelerators and Market Barriers Table 25. North America Automotive Components EMC Testing Revenue Grow Rate (CAGR) by Country (2020 VS 2024 VS 2031) (US$ Million) Table 26. Europe Automotive Components EMC Testing Growth Accelerators and Market Barriers Table 27. Europe Automotive Components EMC Testing Revenue Grow Rate (CAGR) by Country: 2020 VS 2024 VS 2031 (US$ Million) Table 28. Asia-Pacific Automotive Components EMC Testing Growth Accelerators and Market Barriers Table 29. Asia-Pacific Automotive Components EMC Testing Revenue Grow Rate (CAGR) by Region: 2020 VS 2024 VS 2031 (US$ Million) Table 30. Central and South America Automotive Components EMC Testing Investment Opportunities and Key Challenges Table 31. Central and South America Automotive Components EMC Testing Revenue Grow Rate (CAGR) by Country (2020 VS 2024 VS 2031) (US$ Million) Table 32. Middle East and Africa Automotive Components EMC Testing Investment Opportunities and Key Challenges Table 33. Middle East and Africa Automotive Components EMC Testing Revenue Grow Rate (CAGR) by Country (2020 VS 2024 VS 2031) (US$ Million) Table 34. SGS Corporation Information Table 35. SGS Description and Major Businesses Table 36. SGS Product Features and Attributes Table 37. SGS Revenue (US$ Million) and Gross Margin (2020-2025) Table 38. SGS Revenue Proportion by Product in 2024 Table 39. SGS Revenue Proportion by Application in 2024 Table 40. SGS Revenue Proportion by Geographic Area in 2024 Table 41. SGS Automotive Components EMC Testing SWOT Analysis Table 42. SGS Recent Developments Table 43. Bureau Veritas Corporation Information Table 44. Bureau Veritas Description and Major Businesses Table 45. Bureau Veritas Product Features and Attributes Table 46. Bureau Veritas Revenue (US$ Million) and Gross Margin (2020-2025) Table 47. Bureau Veritas Revenue Proportion by Product in 2024 Table 48. Bureau Veritas Revenue Proportion by Application in 2024 Table 49. Bureau Veritas Revenue Proportion by Geographic Area in 2024 Table 50. Bureau Veritas Automotive Components EMC Testing SWOT Analysis Table 51. Bureau Veritas Recent Developments Table 52. TUV SUD Corporation Information Table 53. TUV SUD Description and Major Businesses Table 54. TUV SUD Product Features and Attributes Table 55. TUV SUD Revenue (US$ Million) and Gross Margin (2020-2025) Table 56. TUV SUD Revenue Proportion by Product in 2024 Table 57. TUV SUD Revenue Proportion by Application in 2024 Table 58. TUV SUD Revenue Proportion by Geographic Area in 2024 Table 59. TUV SUD Automotive Components EMC Testing SWOT Analysis Table 60. TUV SUD Recent Developments Table 61. Dekra Corporation Information Table 62. Dekra Description and Major Businesses Table 63. Dekra Product Features and Attributes Table 64. Dekra Revenue (US$ Million) and Gross Margin (2020-2025) Table 65. Dekra Revenue Proportion by Product in 2024 Table 66. Dekra Revenue Proportion by Application in 2024 Table 67. Dekra Revenue Proportion by Geographic Area in 2024 Table 68. Dekra Automotive Components EMC Testing SWOT Analysis Table 69. Dekra Recent Developments Table 70. Intertek Group Corporation Information Table 71. Intertek Group Description and Major Businesses Table 72. Intertek Group Product Features and Attributes Table 73. Intertek Group Revenue (US$ Million) and Gross Margin (2020-2025) Table 74. Intertek Group Revenue Proportion by Product in 2024 Table 75. Intertek Group Revenue Proportion by Application in 2024 Table 76. Intertek Group Revenue Proportion by Geographic Area in 2024 Table 77. Intertek Group Automotive Components EMC Testing SWOT Analysis Table 78. Intertek Group Recent Developments Table 79. UL Solutions Corporation Information Table 80. UL Solutions Description and Major Businesses Table 81. UL Solutions Product Features and Attributes Table 82. UL Solutions Revenue (US$ Million) and Gross Margin (2020-2025) Table 83. UL Solutions Recent Developments Table 84. Applus+ Laboratories Corporation Information Table 85. Applus+ Laboratories Description and Major Businesses Table 86. Applus+ Laboratories Product Features and Attributes Table 87. Applus+ Laboratories Revenue (US$ Million) and Gross Margin (2020-2025) Table 88. Applus+ Laboratories Recent Developments Table 89. Element Corporation Information Table 90. Element Description and Major Businesses Table 91. Element Product Features and Attributes Table 92. Element Revenue (US$ Million) and Gross Margin (2020-2025) Table 93. Element Recent Developments Table 94. Horiba Corporation Information Table 95. Horiba Description and Major Businesses Table 96. Horiba Product Features and Attributes Table 97. Horiba Revenue (US$ Million) and Gross Margin (2020-2025) Table 98. Horiba Recent Developments Table 99. Eurofins MET Labs Corporation Information Table 100. Eurofins MET Labs Description and Major Businesses Table 101. Eurofins MET Labs Product Features and Attributes Table 102. Eurofins MET Labs Revenue (US$ Million) and Gross Margin (2020-2025) Table 103. Eurofins MET Labs Recent Developments Table 104. SMVIC Corporation Information Table 105. SMVIC Description and Major Businesses Table 106. SMVIC Product Features and Attributes Table 107. SMVIC Revenue (US$ Million) and Gross Margin (2020-2025) Table 108. SMVIC Recent Developments Table 109. CTI Corporation Information Table 110. CTI Description and Major Businesses Table 111. CTI Product Features and Attributes Table 112. CTI Revenue (US$ Million) and Gross Margin (2020-2025) Table 113. CTI Recent Developments Table 114. NTEK Corporation Information Table 115. NTEK Description and Major Businesses Table 116. NTEK Product Features and Attributes Table 117. NTEK Revenue (US$ Million) and Gross Margin (2020-2025) Table 118. NTEK Recent Developments Table 119. Nanjing Rongce Testing Technology Corporation Information Table 120. Nanjing Rongce Testing Technology Description and Major Businesses Table 121. Nanjing Rongce Testing Technology Product Features and Attributes Table 122. Nanjing Rongce Testing Technology Revenue (US$ Million) and Gross Margin (2020-2025) Table 123. Nanjing Rongce Testing Technology Recent Developments Table 124. Suzhou NEOtest Corporation Information Table 125. Suzhou NEOtest Description and Major Businesses Table 126. Suzhou NEOtest Product Features and Attributes Table 127. Suzhou NEOtest Revenue (US$ Million) and Gross Margin (2020-2025) Table 128. Suzhou NEOtest Recent Developments Table 129. Raw Materials Key Suppliers Table 130. Distributors List Table 131. Market Trends and Market Evolution Table 132. Market Drivers and Opportunities Table 133. Market Challenges, Risks, and Restraints Table 134. Research Programs/Design for This Report Table 135. Key Data Information from Secondary Sources Table 136. Key Data Information from Primary Sources
List of Figures Figure 1. Automotive Components EMC Testing Product Picture Figure 2. Global Automotive Components EMC Testing Market Size Growth Rate by Type, 2020 VS 2024 VS 2031 (US$ Million) Figure 3. Interference Testing (EMI) Product Picture Figure 4. Immunity Testing (EMS) Product Picture Figure 5. Global Automotive Components EMC Testing Market Size Growth Rate by Application, 2020 VS 2024 VS 2031 (US$ Million) Figure 6. Commercial Vehicles Figure 7. Passenger Vehicles Figure 8. Automotive Components EMC Testing Report Years Considered Figure 9. Global Automotive Components EMC Testing Revenue, (US$ Million), 2020 VS 2024 VS 2031 Figure 10. Global Automotive Components EMC Testing Revenue (2020-2031) & (US$ Million) Figure 11. Global Automotive Components EMC Testing Revenue (CAGR) by Region: 2020 VS 2024 VS 2031 (US$ Million) Figure 12. Global Automotive Components EMC Testing Revenue Market Share by Region (2020-2031) Figure 13. Global Automotive Components EMC Testing Revenue Market Share Ranking (2024) Figure 14. Tier Distribution by Revenue Contribution (2020 VS 2024) Figure 15. Interference Testing (EMI) Revenue Market Share by Player in 2024 Figure 16. Immunity Testing (EMS) Revenue Market Share by Player in 2024 Figure 17. Global Automotive Components EMC Testing Revenue Market Share by Type (2020-2031) Figure 18. Global Automotive Components EMC Testing Revenue Market Share by Application (2020-2031) Figure 19. North America Automotive Components EMC Testing Revenue YoY (2020-2031) & (US$ Million) Figure 20. North America Top 5 Players Automotive Components EMC Testing Revenue (US$ Million) in 2024 Figure 21. North America Automotive Components EMC Testing Revenue (US$ Million) by Type (2020 – 2031) Figure 22. North America Automotive Components EMC Testing Revenue (US$ Million) by Application (2020-2031) Figure 23. US Automotive Components EMC Testing Revenue (2020-2031) & (US$ Million) Figure 24. Canada Automotive Components EMC Testing Revenue (2020-2031) & (US$ Million) Figure 25. Mexico Automotive Components EMC Testing Revenue (2020-2031) & (US$ Million) Figure 26. Europe Automotive Components EMC Testing Revenue YoY (2020-2031) & (US$ Million) Figure 27. Europe Top 5 Players Automotive Components EMC Testing Revenue (US$ Million) in 2024 Figure 28. Europe Automotive Components EMC Testing Revenue (US$ Million) by Type (2020-2031) Figure 29. Europe Automotive Components EMC Testing Revenue (US$ Million) by Application (2020-2031) Figure 30. Germany Automotive Components EMC Testing Revenue (2020-2031) & (US$ Million) Figure 31. France Automotive Components EMC Testing Revenue (2020-2031) & (US$ Million) Figure 32. U.K. Automotive Components EMC Testing Revenue (2020-2031) & (US$ Million) Figure 33. Italy Automotive Components EMC Testing Revenue (2020-2031) & (US$ Million) Figure 34. Russia Automotive Components EMC Testing Revenue (2020-2031) & (US$ Million) Figure 35. Asia-Pacific Automotive Components EMC Testing Revenue YoY (2020-2031) & (US$ Million) Figure 36. Asia-Pacific Top 8 Players Automotive Components EMC Testing Revenue (US$ Million) in 2024 Figure 37. Asia-Pacific Automotive Components EMC Testing Revenue (US$ Million) by Type (2020-2031) Figure 38. Asia-Pacific Automotive Components EMC Testing Revenue (US$ Million) by Application (2020-2031) Figure 39. Indonesia Automotive Components EMC Testing Revenue (2020-2031) & (US$ Million) Figure 40. Japan Automotive Components EMC Testing Revenue (2020-2031) & (US$ Million) Figure 41. South Korea Automotive Components EMC Testing Revenue (2020-2031) & (US$ Million) Figure 42. Australia Automotive Components EMC Testing Revenue (2020-2031) & (US$ Million) Figure 43. India Automotive Components EMC Testing Revenue (2020-2031) & (US$ Million) Figure 44. Indonesia Automotive Components EMC Testing Revenue (2020-2031) & (US$ Million) Figure 45. Vietnam Automotive Components EMC Testing Revenue (2020-2031) & (US$ Million) Figure 46. Malaysia Automotive Components EMC Testing Revenue (2020-2031) & (US$ Million) Figure 47. Philippines Automotive Components EMC Testing Revenue (2020-2031) & (US$ Million) Figure 48. Singapore Automotive Components EMC Testing Revenue (2020-2031) & (US$ Million) Figure 49. Central and South America Automotive Components EMC Testing Revenue YoY (2020-2031) & (US$ Million) Figure 50. Central and South America Top 5 Players Automotive Components EMC Testing Revenue (US$ Million) in 2024 Figure 51. Central and South America Automotive Components EMC Testing Revenue (US$ Million) by Type (2020-2031) Figure 52. Central and South America Automotive Components EMC Testing Revenue (US$ Million) by Application (2020-2031) Figure 53. Brazil Automotive Components EMC Testing Revenue (2020-2025) & (US$ Million) Figure 54. Argentina Automotive Components EMC Testing Revenue (2020-2025) & (US$ Million) Figure 55. Middle East and Africa Automotive Components EMC Testing Revenue YoY (2020-2031) & (US$ Million) Figure 56. Middle East and Africa Top 5 Players Automotive Components EMC Testing Revenue (US$ Million) in 2024 Figure 57. South America Automotive Components EMC Testing Revenue (US$ Million) by Type (2020-2031) Figure 58. Middle East and Africa Automotive Components EMC Testing Revenue (US$ Million) by Application (2020-2031) Figure 59. GCC Countries Automotive Components EMC Testing Revenue (2020-2025) & (US$ Million) Figure 60. Israel Automotive Components EMC Testing Revenue (2020-2025) & (US$ Million) Figure 61. Egypt Automotive Components EMC Testing Revenue (2020-2025) & (US$ Million) Figure 62. South Africa Automotive Components EMC Testing Revenue (2020-2025) & (US$ Million) Figure 63. Automotive Components EMC Testing Industry Chain Mapping Figure 64. Channels of Distribution (Direct Vs Distribution) Figure 65. Bottom-up and Top-down Approaches for This Report Figure 66. Data Triangulation Figure 67. Key Executives Interviewed